Performance Monitoring
Overview
The SearchStax Managed Search service provides real-time and historical statistical graphs of critical Solr server and JVM metrics and statistics. These statistics provide a birds-eye view of Solr cluster health, enabling you to tune server performance.
Monitoring Data Retention by Support Level Agreement (SLA)
- “Development” (self-service) accounts retain monitoring data for 24 hours.
- “Core” accounts retain monitor data for 30 days.
- “Enterprise” accounts retain monitoring data for 30 days or more, depending on the contract.
Please see our Pricing page for the most up-to-date information on feature availability for each SLA tier.
Don’t use periods in collection names!
The Pulse monitoring feature cannot display the history of a collection containing a period in the collection name.
Contents of this page:
How to Access the Monitoring Graphs
You can access the graphs from the Deployment Details screen.
To access the graphs:
- From the SearchStax Managed Search dashboard, select Dedicated Infrastructure.
- Choose a deployment from the deployment list.
- Select Monitoring, and then CPU, Memory, JVM.
- Check the nodes to view from the list of nodes. (Note that the Solr nodes of a NextGen cluster are nodes 4 and 5.)
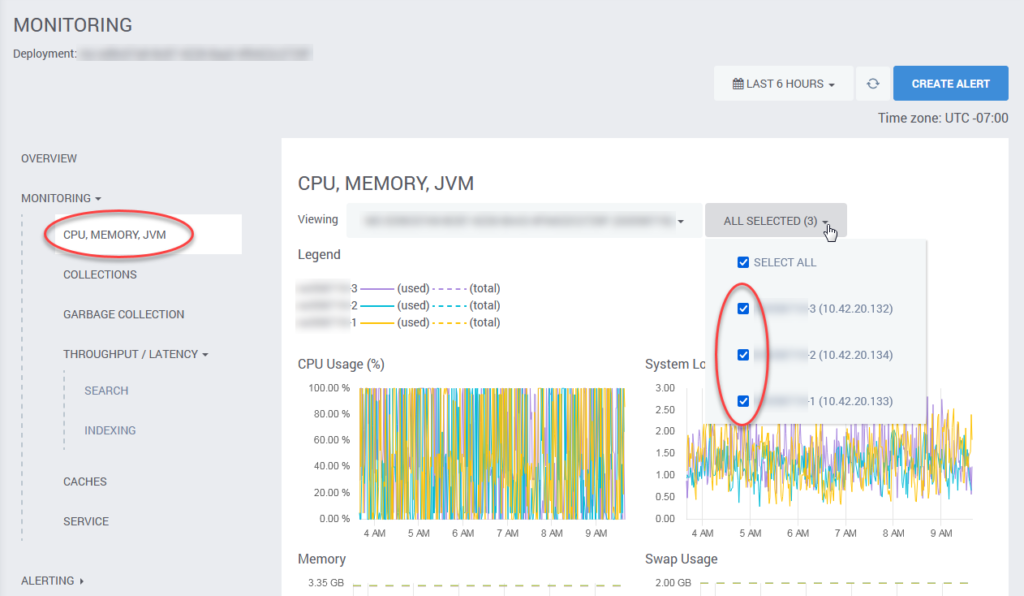
- Set a time interval from the interval button in the upper right. Note that short intervals display more quickly than long intervals.
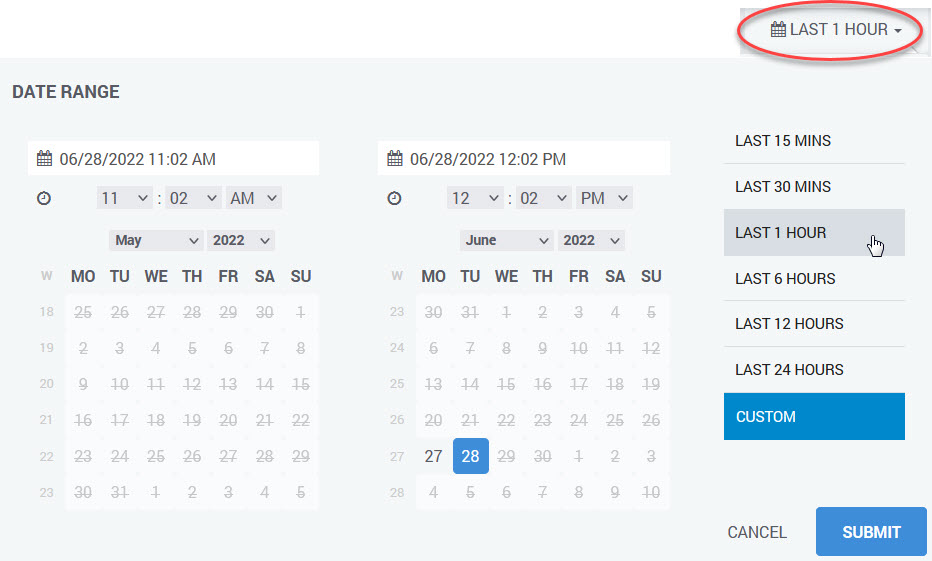
Note the date and time controls at the top of the dialog box. These let you examine data from a small time interval that occurred days or weeks in the past.
About the Graphs
Managed Search provides graphs for the following server and search metrics.
CPU, Memory, JVM
These are monitoring graphs from a server that is running out of memory. Pay close attention to the Y-axis labels. The graph zooms in on the data, so the Y-axis is dynamic.
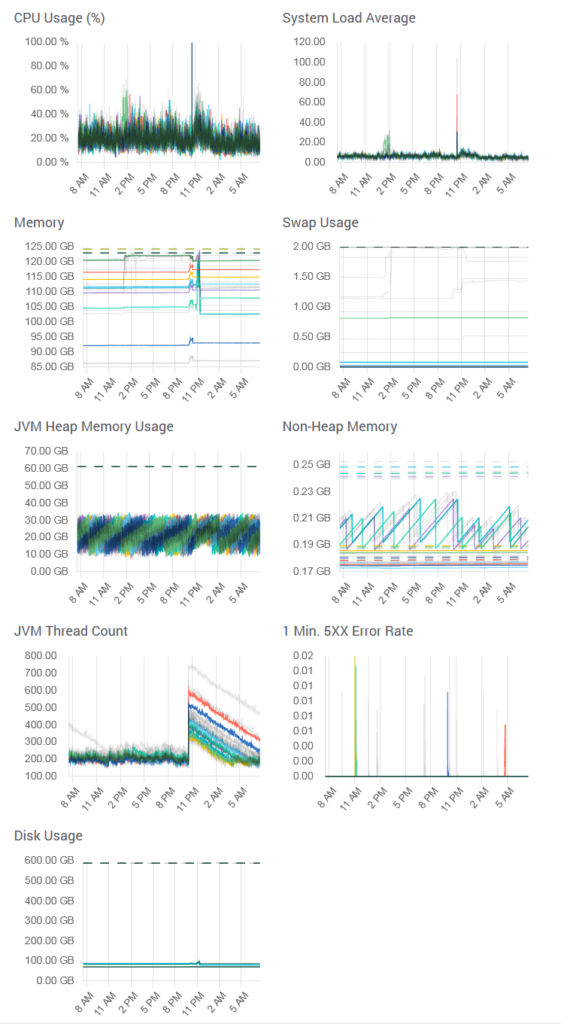
The following server-performance metrics are displayed:
| Metric | Definition |
|---|---|
| Usage | CPU load as a percent of maximum. (See Is 100% CPU a bad thing?) |
| System Load Average | Number of processes per CPU over one-minute intervals. Values below 1.0 indicate that processes are not waiting. |
| Memory | Total memory size and used memory size plotted on a single graph. (See How do I recognize a Solr Out-of-Memory Error?) |
| Swap Usage | Total disc swap space available and used over time. |
| JVM Heap Memory Usage | Heap memory usage over time. Heap memory is used for storing Java objects. When heap memory reaches 100%, Solr stops running. |
| Non-Heap Memory | Non-heap memory usage over time. Non-heap memory is used by Java to store loaded classes and other metadata. |
| JVM Thread Count | Server thread count usage over time. |
| 1 min 5XX Error Rate | 5XX errors summed over one-minute intervals. |
| Disk Usage | Disk space usage in gigabytes. The dashed line is the maximum available. |
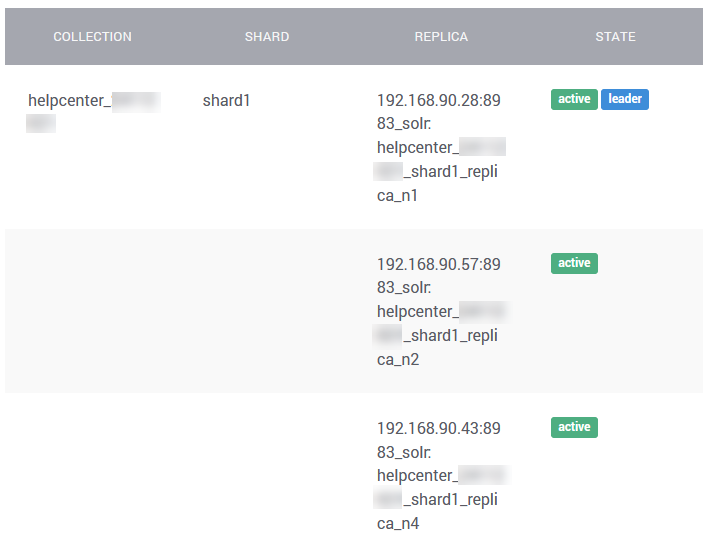
Collections
The Collections table shows the health of replicas across servers.
Garbage Collection
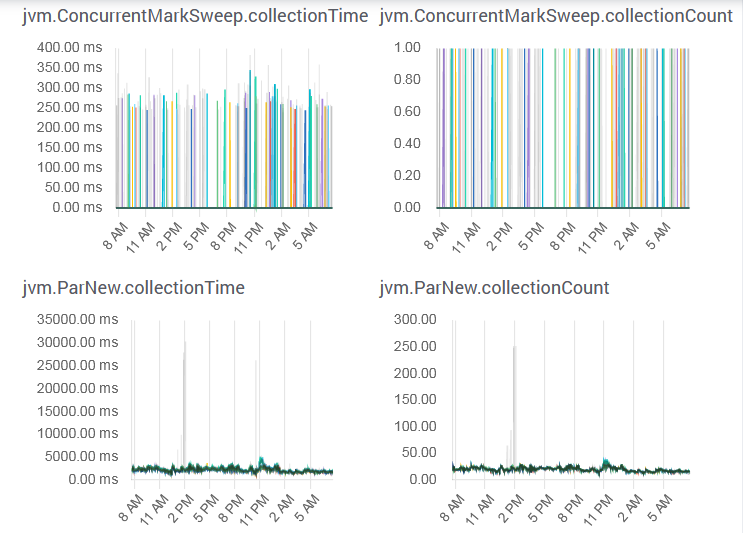
The following garbage-collection metrics are reported by Managed Search:
| Metric | Definition |
|---|---|
| ConcurrentMarkSweep CollectionTime & CollectionCount | Collection time and count for the ConcurrentMarkSweep approach. |
| ParNew CollectionTime & CollectionCount | Collection time and count for the ParNew approach. |
Search Throughput and Latency
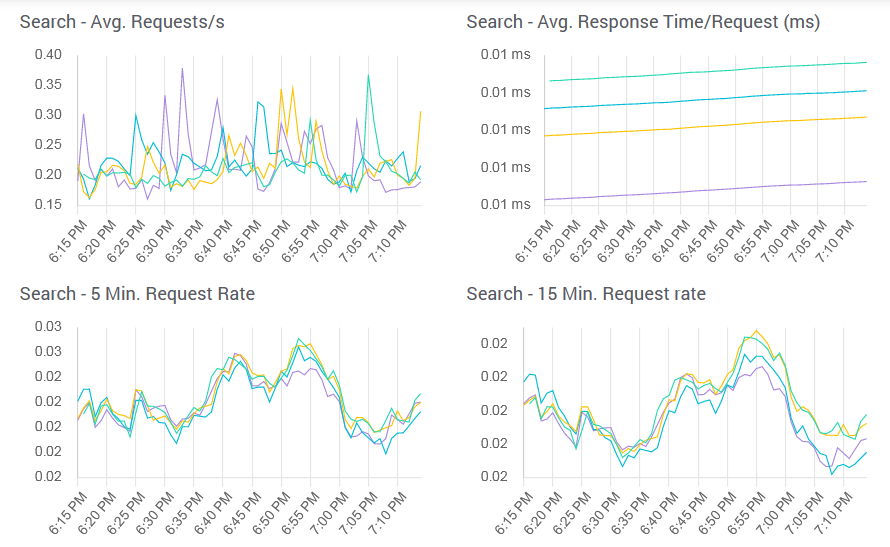
Managed Search provides graphs that report on throughput and latency.
| Metric | Definition |
|---|---|
| Average Requests/second (ms) | Reports average search requests per second. |
| Average Time/Request (ms) | Reports average time for search request to fulfill the query. |
| 5-minute Request Rate | Reports search-request rate over a 5-minute interval. |
| 15-minute Request Rate | Reports search-request rate over 15-minute interval. |
| Timeouts | Reports server timeouts, where the server did not respond to the request fast enough. |
| Errors | Numbers of search-request errors. |
Indexing Throughput and Latency
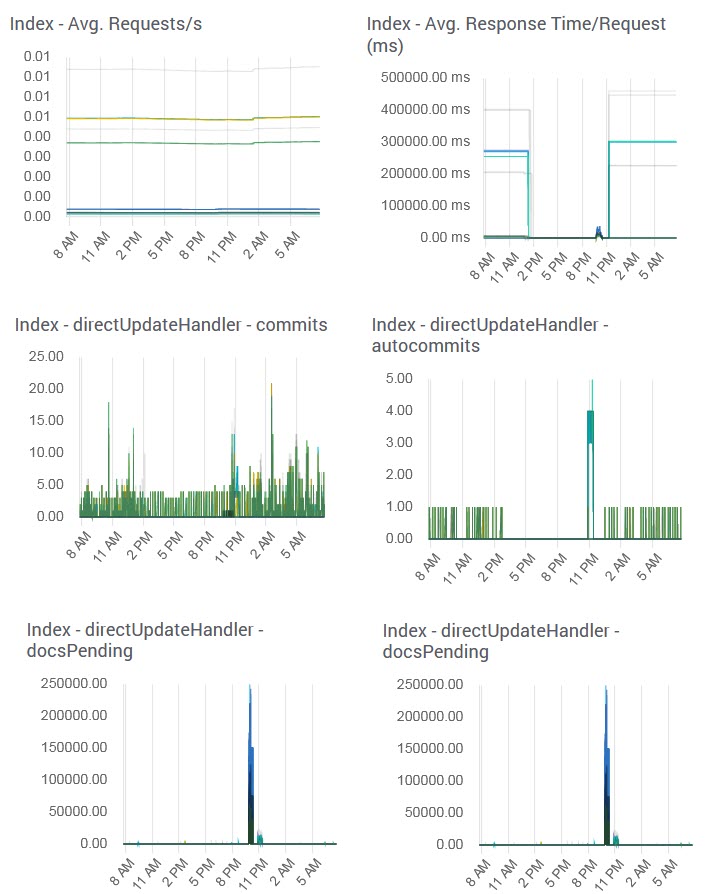
Managed Search provides graphs that report on throughput and latency.
| Metric | Definition |
|---|---|
| Average Requests/Second | Reports average indexing requests per second. |
| Average Time/Request (ms) | Reports average time for indexing request to fulfill the query. |
| Timeouts | Reports server timeouts, where the server did not respond to the request fast enough. |
| Errors | Numbers of indexing request errors. |
| Update Handler graphs | Reports various Update Handler metrics over a period of time, such as commits, autoCommits, deletesById, etc. |
Caches
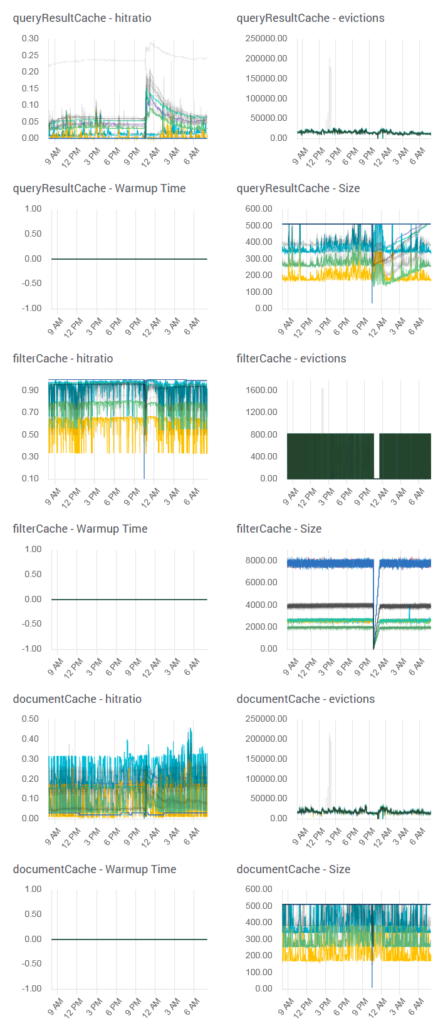
SearchStax Managed Search provides graphs that report on Caches.
| Metric | Definition |
|---|---|
| QueryResultCache | This cache stores ordered sets of document IDs — the top N results of a query ordered by some criterion. Multiple metrics report how the query result cache is being utilized to fulfill search requests. Metrics include hit ratio, evictions, warmup time, etc. |
| FilterCache | This cache stores unordered sets of document IDs that match the queries. Multiple metrics report how the filter cache is being utilized to fulfill search requests. Metrics include itratio, evictions, warmup time, etc. |
| DocumentCache | The documentCache stores Lucene Document objects that have been fetched from disk. Multiple metrics report how the document cache is being utilized. Metrics include itratio, evictions, warmup time, etc. |
| FieldValueCache | The fieldValueCache is similar to fieldCache, and supports multiple values per document. It is primarily used for faceting. Metrics include warmup time, size. |
Service – Total Requests
Clients running clustered deployments may view one more graph. The Service graph displays the number of requests received by the cluster’s Load Balancer over time. This can reveal cyclic patterns of high demand:
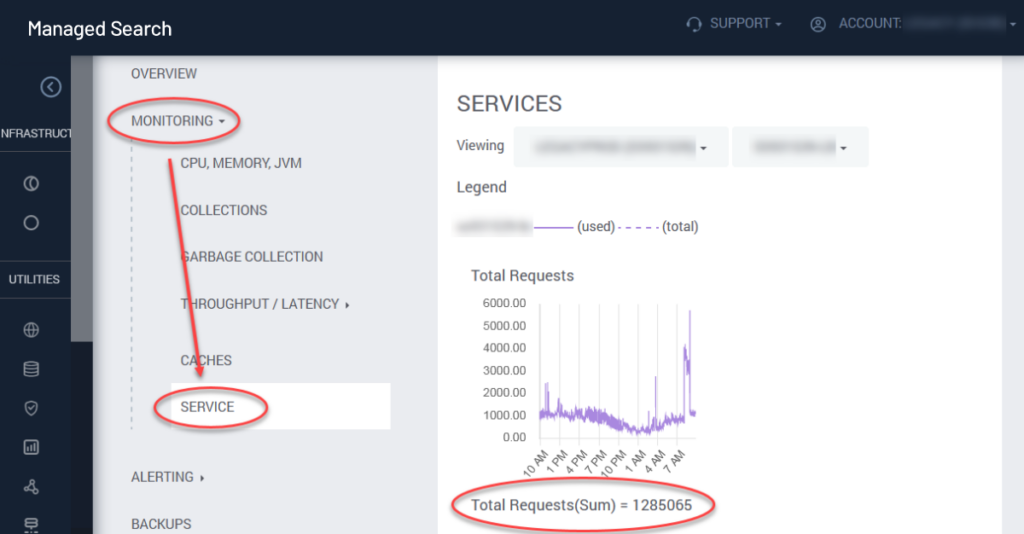
“Requests” include all external messages directed to the Solr cluster, such as /select and /update messages plus API calls and Pulse monitoring.
Availability Report
Premium clients (Core, and Enterprise SLAs) get access to an Availability Report in the SearchStax dashboard. This is a graph and a summary that documents response time and downtime so they can be compared with the guarantees of the SLA.
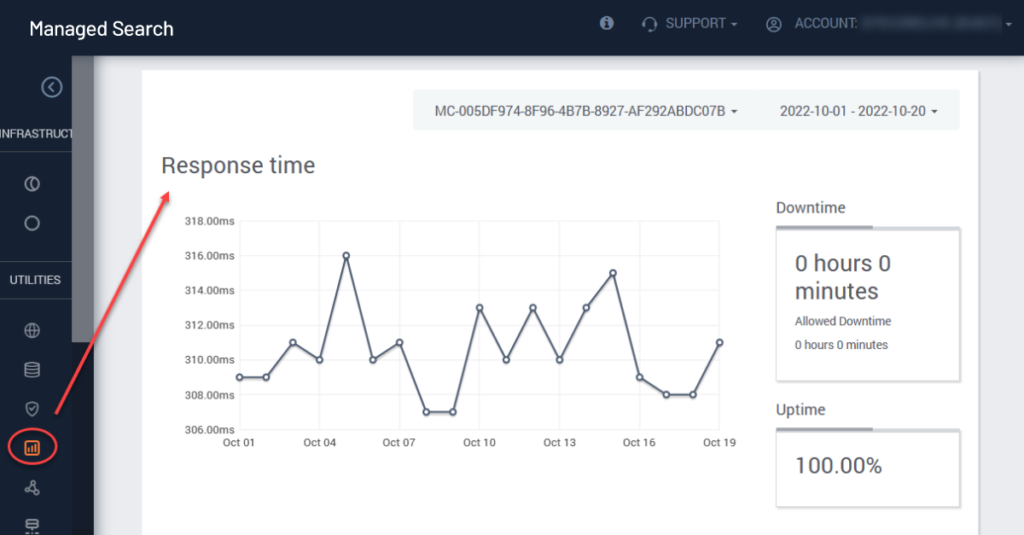
Note that this feature is accessed through the Availability Report screen of the SearchStax Managed Search dashboard.
Alerting
The SearchStax Managed Search alerting features are described on the Solr Service Alerting page.
Questions?
Do not hesitate to contact the SearchStax Support Desk.