


Mar. 02, 2017
Sameer Maggon
|
How quickly does your search application respond to a typical user query? Since every query is different, this question isn’t easy to answer. Latency statistics let us describe the responsiveness seen by a typical user, based on actual queries from the field.
At Measured Search, we are excited to announce the addition of Average, 95th percentile, and 99th percentile latency to our suite of SearchStax analytics reports. Below are the three new statistics shown in SearchStax Analytic’s App Overview display:
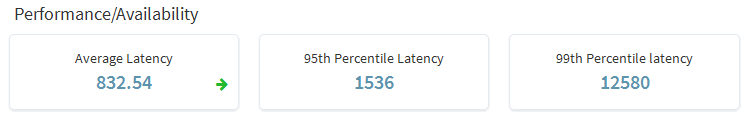
This performance metric is expressed in milliseconds.
- Average Latency: Average of all queries responded within this time.
- 95th Percentile Latency: 95% of all queries responded within this time.
- 99th Percentile Latency: 99% of all queries responded within this time.
At Measured Search, we are excited to announce the addition of Average, 95th percentile, and 99th percentile latency to our suite of SearchStax analytics reports. Below are the three new statistics shown in SearchStax Analytic’s App Overview display:
In the example above, the average query was returned within a second, which is encouraging. 95% returned in a second and a half (or so). Then there were a few queries that required multiple seconds of computation. Nearly all queries (99%) returned within 12.6 seconds. Overall, this is a very responsive system. But we might want to take a closer look at the slow queries. SearchStax lets us view the slow queries in the Top Searches display.
For additional information see the App Overview discussion in the SearchStax User’s Guide. Click the link to learn more about SearchStax, the leading Solr-as-a-Service platform.