

Monitoring Solr Health
A Solr monitoring system enables you to gather and analyze statistics, and visualize metrics, events, logs, and traces in real time. The screenshots in this blog post come from the Monitoring feature of SearchStax Managed Search. Pulsethe Monitoring features allows users to monitor the health of a Solr deployment using real-time and historical statistical graphs of critical Solr server and JVM metrics. For increased flexibility, you can also define the time frame and frequency of the performance graphs.
Let’s dive into the four critical metrics for monitoring the health of your Solr deployment:
- JVM Heap Memory
- System Load Average
- Disk Space
- Errors of all kinds
1. JVM Heap Memory
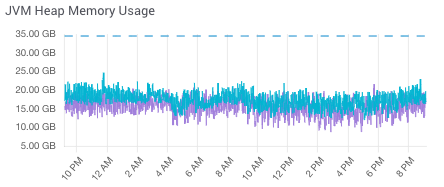
As a Java application, Solr consumes JVM Heap Memory and consumption is typically observed in a zigzag pattern. Understanding JVM Heap Memory as a standalone metric is important because running out of it will cause Solr to reach an Out-Of-Memory (OOM) state and cause a loss of the Solr service.
We recommend configuring JVM Heap Memory alerts and taking action if JVM Heap Memory reaches an 80% threshold. Corrective actions can include pausing or throttling the indexing processes from your application or, if Solr is running in a clustered topology, restarting nodes one at a time to rebalance consumption to avoid any system downtime. If high JVM Heap Memory consumption persists, you may need to optimize how the application is making requests to Solr and possibly upgrade the size of your Solr deployment.
The graph below depicts JVM Heap Memory consumption with the resource threshold being depicted with a dotted line at the top of the x-axis.
2. System Load Average
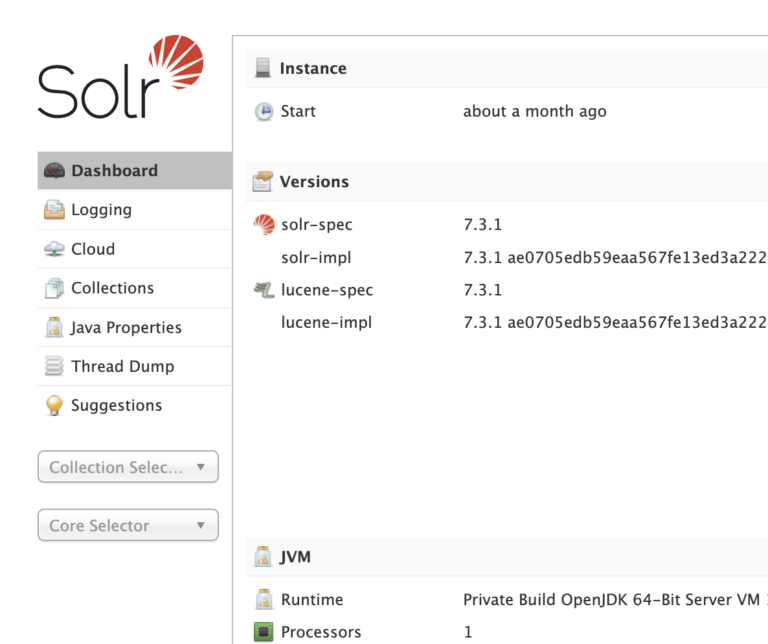
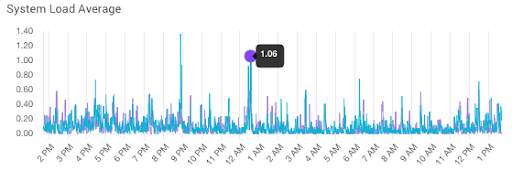
System Load Average metrics are commonly intertwined with the CPU Usage graph in Pulse. To understand System Load Average, you need to be familiar with the configuration of the Deployment you are analyzing. The number of virtual central processing units (vCPUs) available provides context into how sustainable the System Load Average is in its current state.
You can view the vCPUs for your deployment from the Solr Admin Interface – JVM > Processors. As shown below, this deployment has 1 vCPU.
3. Disk Usage
Disk Usage is another critical metric to track and understand as high Disk Usage (or its inverse, Free Disk Space) can result in corrupted files, high error rates and general system instability.
SearchStax recommends configuring alerts and taking action if Disk Usage reaches 80% of the threshold. Clearing unneeded index data is encouraged, but SearchStax also provides the option to purchase additional disk space if needed. Before adding more disk space, you need to understand what is consuming space on your disk storage and analyze why additional space is recommended.
If your project has business requirements for periodic backups, then additional disk space is required. Backups are taken on disk locally before they get exported to blob storage in the specified cloud region. In addition to backups, log expansion and index segmentation require additional disk space.
As a best practice, SearchStax recommends selecting a deployment plan size with three times the amount of disk space that you expect the Solr indexes to occupy.
The graph below shows a deployment with an observable Solr backup that started at 10am and temporarily consumes disk space until the backup was migrated into a blob storage for longer retention.
4. Errors of All Kinds for Solr Health
SearchStax Monitoring provides metrics on several types of key errors and these errors should be avoided as they impact application functionality and performance. CPU Usage and System Load Average will rise if errors occur frequently as these processes are more compute intensive than a 200 response.
We typically configure alerts on:
- 5xx Errors
- Index Error Counts
- Search Error Counts
- Direct Update Handler Errors
As best practice, SearchStax recommends setting alerts on all deployment nodes for Index Error Counts to provide you with notice when documents being indexed are greeted with missing field or undefined field index errors. It’s important for all your data to be properly ingested and to avoid using additional compute resources.
The graph below shows Index Error Counts. We recommend configuring alerts that will identify when 10 error counts occur within a span of 5 minutes as a call to action.
In this System Load Average graph below, you can see how the errors are consuming additional compute power to resolve the erroring requests.
Use Solr Alerting to Look at Exceptions Only
In addition to the real time Solr health metrics, SearchStax Cloud also has an automated Solr Alerting feature that lets users create Solr Heartbeat or Solr Threshold alerts which will send emails when the alerts are triggered. These alerts can also be added to the alerting tool of your choice using Webhooks to access the API.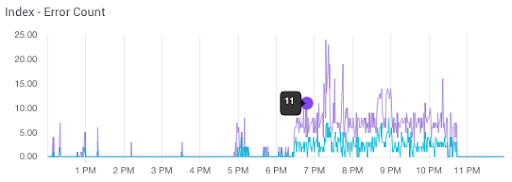
Get a Demo of SearchStax Cloud
Solr offers great performance, features, customizability and scalability, but requires tuning for optimal benefit.
Let us solve the technical aspects of your Solr infrastructure. With SearchStax Managed Search is a fully-managed SaaS solution that automates, manages, maintains and scales Solr search infrastructure in public or private clouds. We take care of Solr and make sure you have a reliable, secure and compliant Solr setup so you can focus on more value-added tasks. Schedule a demo or start a free trial to see how SearchStax Cloud can automate, manage and scale Solr for your project.
Get a Demo of SearchStax Cloud
Apache Solr is an open-source search platform that is used to build search applications. It is built on top of the Apache Lucene search library, which is a high-performance, full-featured text search engine written in Java. Solr provides additional features and functionalities that make it easier to set up and manage search applications.
SearchStax offers two solutions around Solr.
- SearchStax Managed Search is a fully-managed SaaS solution that automates, manages, maintains and scales Solr search infrastructure in public or private clouds.
- SearchStax Site Search delivers advanced, modern and personalized search for your website or custom application. Studio adds out-of-the-box search analytics and provides easy-to-use tools for marketers to control the key features of Solr including ranking, facets, spellcheck, synonyms, stopwords, rules, filters and promotions.
SearchStax Managed Search is a fully-managed SaaS solution that automates, manages, maintains and scales Solr search infrastructure in public or private clouds.
If your Solr system has low performance, out-of-memory errors, or frequent issues with replicas falling into recovery mode, then be sure to check out these useful blog posts from SearchStax:

Get Our Newsletter
The Stack is delivered bi-monthly with industry trends, insights, products and more
Product manager who focuses on search infrastructure management and helping teams build faster with greater focus and confidence