
Items
Studio > Analytics > Items
The Analytics – Items screen presents insights on the content that mattered most, least, and that did not interest the viewer. It shows lists of ranked result-items, and lets you click through to see the searches that led to each item.
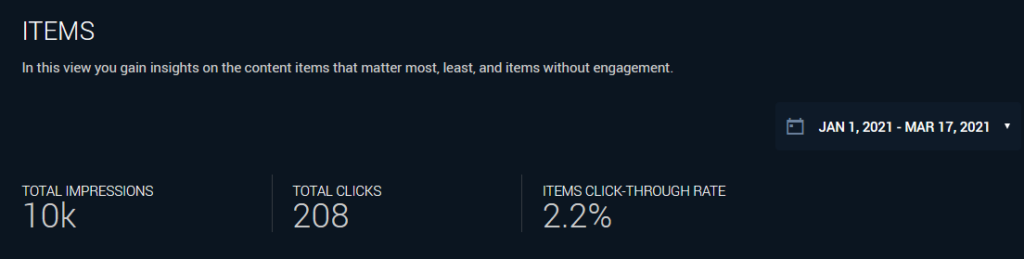
- Total Impressions: Number of result items displayed during the selected time interval.
- Total Clicks: Number of click-through events in the selected time interval.
- Items Click-Through Rate: Percentage of Total Impressions that received a click-through event.
The Most Clicked table shows the result items that were clicked the most.
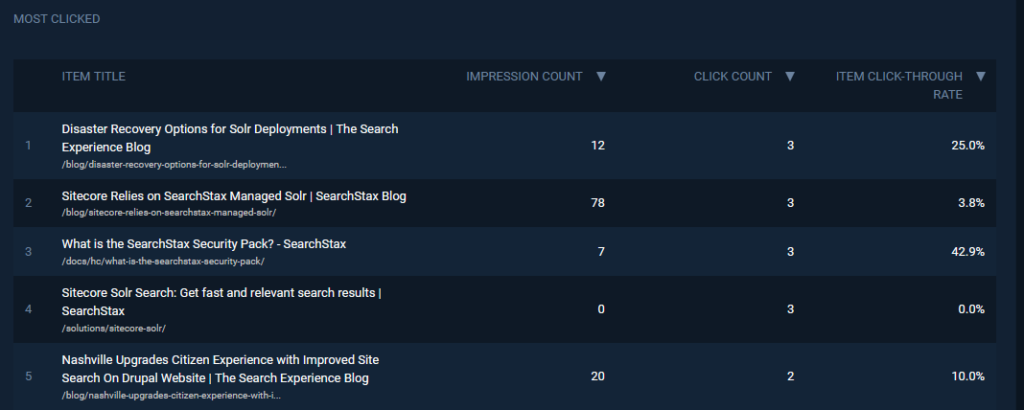
- Item Title: The title of a document that users clicked on during the selected time interval.
- Impression Count: The number of times that this item was presented to users in search results during the selected time interval.
- Click Count: Number of click-through events for this item in the selected time interval.
- Item Click-Through Rate: Percent of Impressions that were clicked on.
You can click on any item to see the Item Details view.
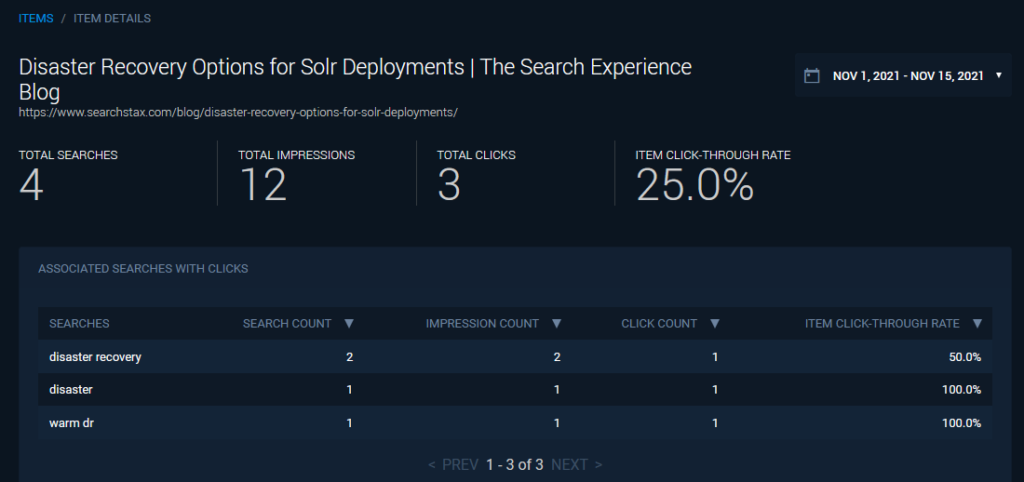
- Total Searches: Number of searches in this time period that matched this item.
- Total Impressions: Number of times the item was presented to users in the results list.
- Total Clicks: Number of click-through events on this item.
- Item Click-Through Rate: Percent of Impressions that received a click-through event.
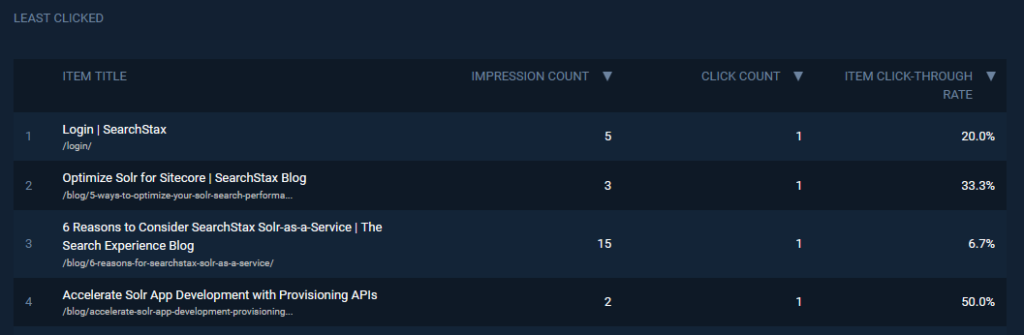
Use the “back” button to return to the Analytics – Items screen. Scroll down to view the list of “Least Clicked,” meaning content items that had little or no engagement.
See our Analytics Glossary for a list of all SearchStax Studio metrics.
Questions?
Do not hesitate to contact the SearchStax Support Desk.